Nouveauté
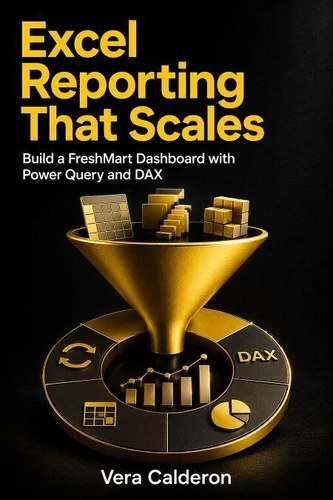
Excel Reporting That Scales. Build a FreshMart Dashboard with Power Query and DAX
Par :Formats :
Disponible dans votre compte client Decitre ou Furet du Nord dès validation de votre commande. Le format ePub est :
- Compatible avec une lecture sur My Vivlio (smartphone, tablette, ordinateur)
- Compatible avec une lecture sur liseuses Vivlio
- Pour les liseuses autres que Vivlio, vous devez utiliser le logiciel Adobe Digital Edition. Non compatible avec la lecture sur les liseuses Kindle, Remarkable et Sony
 , qui est-ce ?
Notre partenaire de plateforme de lecture numérique où vous retrouverez l'ensemble de vos ebooks gratuitement
Pour en savoir plus sur nos ebooks, consultez notre aide en ligne ici
C'est si simple ! Lisez votre ebook avec l'app Vivlio sur votre tablette, mobile ou ordinateur :

- FormatePub
- ISBN8259604216
- EAN9798259604216
- Date de parution29/06/2026
- Protection num.pas de protection
- Taille870 Ko
- Infos supplémentairesepub
- ÉditeurChiify
Résumé
Excel reporting and Power Query. Stop wrestling with messy spreadsheets and start building reports that actually scale. Excel Reporting That Scales is the hands-on guide for analysts, managers, and BI beginners who want to turn scattered data into clean, refreshable business intelligence using Power Query and pivot tables. Power Query and pivot tables are your keys to automating data cleaning and creating dynamic summaries-no coding required.
This book takes you from absolute beginner to confident pro, with step-by-step tutorials, real-world examples, and practical exercises you can apply immediately. Learn how to connect multiple data sources, transform raw data into analysis-ready tables, and build interactive dashboards that update with a single click. Unlike Excel: The Absolute Beginner's Guide to Maximizing Your Excel Experience by [placeholder] or The Definitive Guide to DAX by [placeholder], this book focuses on the tools that matter most for everyday reporting: Power Query for data transformation and pivot tables for summarization.
You'll master techniques to handle millions of rows, create measures with DAX, and design reports your team can trust and refresh themselves. Whether you're preparing monthly sales reports, financial summaries, or operational dashboards, this book gives you a scalable system that grows with your data. Say goodbye to manual copy-paste and hello to automated, professional-grade BI in Excel. Vera Calderon demystifies Power Query and pivot tables, showing you how to combine them for maximum impact.
By the end, you'll have a repeatable process for any data challenge-from messy CSV files to complex relational models. This is not just another Excel book; it's your blueprint for building reporting that scales, impresses, and saves hours every week. Start today and transform your Excel skills into a career asset.
This book takes you from absolute beginner to confident pro, with step-by-step tutorials, real-world examples, and practical exercises you can apply immediately. Learn how to connect multiple data sources, transform raw data into analysis-ready tables, and build interactive dashboards that update with a single click. Unlike Excel: The Absolute Beginner's Guide to Maximizing Your Excel Experience by [placeholder] or The Definitive Guide to DAX by [placeholder], this book focuses on the tools that matter most for everyday reporting: Power Query for data transformation and pivot tables for summarization.
You'll master techniques to handle millions of rows, create measures with DAX, and design reports your team can trust and refresh themselves. Whether you're preparing monthly sales reports, financial summaries, or operational dashboards, this book gives you a scalable system that grows with your data. Say goodbye to manual copy-paste and hello to automated, professional-grade BI in Excel. Vera Calderon demystifies Power Query and pivot tables, showing you how to combine them for maximum impact.
By the end, you'll have a repeatable process for any data challenge-from messy CSV files to complex relational models. This is not just another Excel book; it's your blueprint for building reporting that scales, impresses, and saves hours every week. Start today and transform your Excel skills into a career asset.