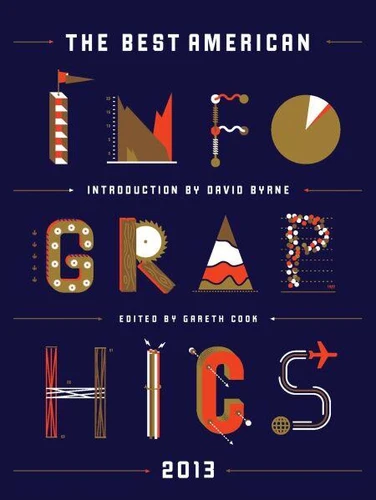
Best American Infographics 2013 /anglais
Par :Formats :
Disponible dans votre compte client Decitre ou Furet du Nord dès validation de votre commande. Le format ePub protégé est :
- Compatible avec une lecture sur My Vivlio (smartphone, tablette, ordinateur)
- Compatible avec une lecture sur liseuses Vivlio
- Pour les liseuses autres que Vivlio, vous devez utiliser le logiciel Adobe Digital Edition. Non compatible avec la lecture sur les liseuses Kindle, Remarkable et Sony
- Non compatible avec un achat hors France métropolitaine
 , qui est-ce ?
Notre partenaire de plateforme de lecture numérique où vous retrouverez l'ensemble de vos ebooks gratuitement
Pour en savoir plus sur nos ebooks, consultez notre aide en ligne ici
- Nombre de pages184
- FormatePub
- ISBN978-0-544-10555-3
- EAN9780544105553
- Date de parution08/10/2013
- Protection num.Adobe DRM
- Infos supplémentairesepub
- ÉditeurMariner Books
Résumé
The rise of infographics across virtually all print and electronic media-from a striking breakdown of classic cocktails to a graphic tracking 200 influential moments that changed the world to visually arresting depictions of Twitter traffic-reveals patterns in our lives and our world in fresh and surprising ways. In the era of big data, where information moves faster than ever, infographics provide us with quick, often influential bursts of art and knowledge-on the environment, politics, social issues, health, sports, arts and culture, and more-to digest, to tweet, to share, to go viral.
The Best American Infographics captures the finest examples from the past year, including the ten best interactive infographics, of this mesmerizing new way of seeing and understanding our world.
The Best American Infographics captures the finest examples from the past year, including the ten best interactive infographics, of this mesmerizing new way of seeing and understanding our world.


